Products
Jump to:
- Coupled Northwest Atlantic Prediction System (CNAPS)
- South Atlantic Bight - Gulf of Mexico model (SABGOM)
- Harmful Algal Blooms in the Gulf of Maine
- Gulf of Maine Cloud-Free SST and Chl-a
|
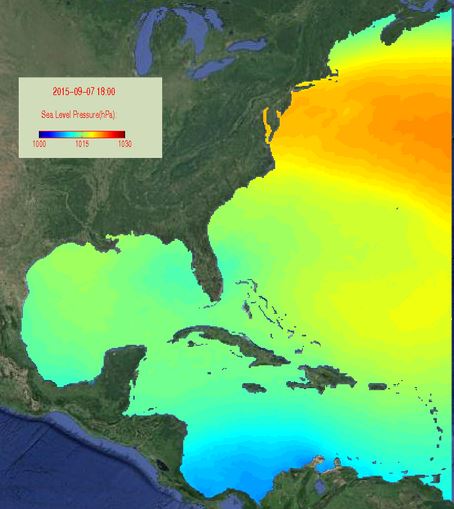
CNAPSThe Coupled Northwest Atlantic Prediction System (CNAPS) is a three-dimensional marine environment nowcast and forecast model developed by the Ocean Observing and Modeling Group. This fully coupled ocean circulation, wave, and atmosphere modeling system predicts conditions over a wide area of the coastal northwest Atlantic Ocean on a daily basis. The model domain covers from the eastern edge of Nova Scotia to the north coast of Venezuela, including the Gulf of Maine, Middle Atlantic Bight, South Atlantic Bight, Gulf of Mexico, Caribbean Sea, and western Sargasso Sea.
Virtual Oceanographer allows users to take on the role of oceanographer, by collecting model-generated data. User-defined inquires include virtual transect (subsurface temperature, salinity, and velocity plots), virtual sounding (temperature and salinity profiles), and 72 hour particle trajectory prediction (Lagrangian drifters). |
||||||||||||||||||||||||||||||||||||||||||||||||||||||||||||||||||||||||||
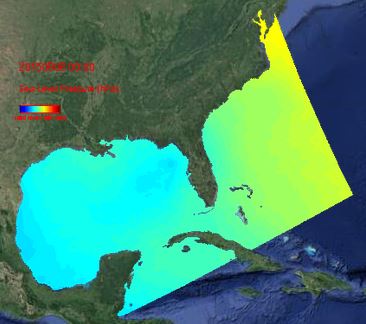 |
SABGOMThe South Atlantic Bight - Gulf of Mexico (SABGOM) model is a three-dimensional marine environment nowcast and forecast model developed by the Ocean Observing and Modeling Group. This system provides predictions of ocean circulation, wave, and atmosphere conditions over the South Atlantic Bight and Gulf of Mexico on a daily basis. The model domain covers the U.S. east coast from New Jersey southward, including the South Atlantic Bight, Gulf of Mexico, northwest corner of the Caribbean Sea, and western edge of the Sargasso Sea.
Details of the model and its verification can be found in Xue, Z., J. Zambon, Z. Yao, Y. Liu, and R. He (2015) An integrated ocean circulation, wave, atmosphere, and marine ecosystem prediction system for the South Atlantic Bight and Gulf of Mexico, Journal of Operational Oceanography, doi:10.1080/1755876X.2015.1014667. [PDF] go to SABGOM site |
||||||||||||||||||||||||||||||||||||||||||||||||||||||||||||||||||||||||||
|
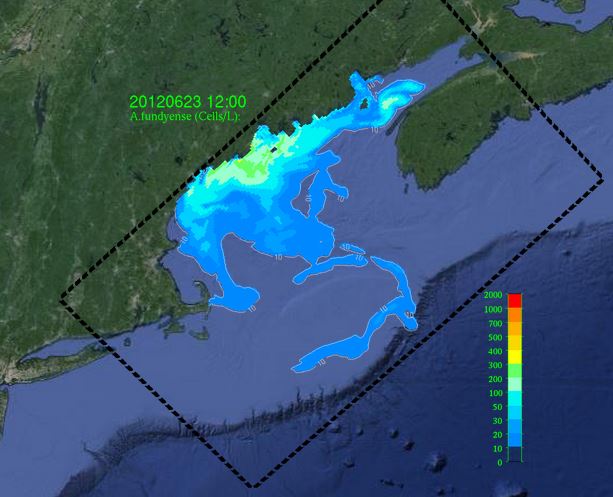
Harmful Algal Blooms in the Gulf of MaineWeekly forecasts of blooms of the harmful alga Alexandrium fundyense in the Gulf of Maine are made each spring and summer using a coupled physical - biological model. The coupled system consists of a state-of-the-art, free-surface primitive equation Regional Ocean Modeling System (ROMS) tailored for the Gulf of Maine using a multinested configuration and a population dynamics model for A. fundyense. The system is forced by realistic momentum and buoyancy fluxes, tides, river runoff, observed A. fundyense benthic cyst abundance, and climatological nutrient fields. Details of the model and its verification can be found in
To subscribe to the seasonal weekly newsletter reporting bloom predictions, contact us at OceanObservingAndModeling [at] ncsu [dot] edu. Data from the model predictions of past years can be viewed by clicking the buttons below:
|
||||||||||||||||||||||||||||||||||||||||||||||||||||||||||||||||||||||||||
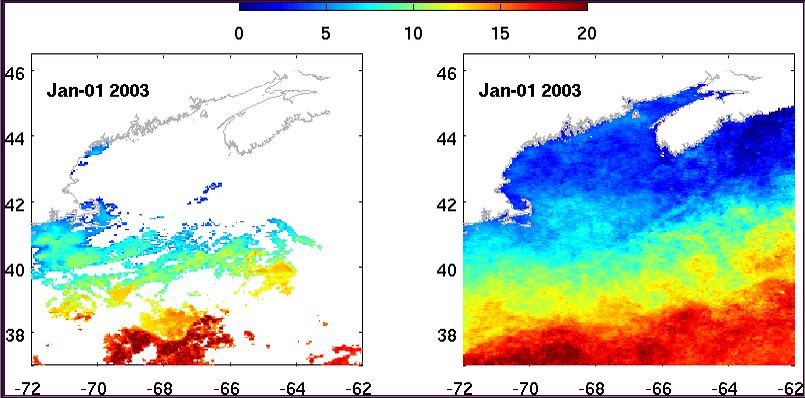 |
Gulf of Maine Cloud-Free SST and Chl-aComplete maps, unobscured by cloud cover, of sea surface temperature (SST) and chlorophyll a (Chl-a) are available for the Gulf of Maine from 2003 to 2012. These accurate space and time reconstructions of cloud-covered ocean surface have been created using the Data INterpolating Empirical Orthogonal Function (DINEOF) applied to MODIS data (http://modis.gsfc.nasa.gov/). This method identifies dominant spatial and temporal patterns and fills in missing (cloud-covered) points accordingly. Original satellite data, with surface osbcured by clouds, and reconstructions can be viewed side by side at each site. go to Gulf of Maine cloud-free Chl-a site |