Gulf of
Ruoying He1, Yizhen Li1, Dennis McGillicuddy2, Don Anderson2, Bruce Keafer2
1North
2Woods Hole Oceanographic Institution
Disclaimer: these simulations are for experimental purposes only.
Results here represent model solutions initiated from a cyst abundance map from October 2013, with germination, growth, and transport of Alexandrium fundyense cells driven by the factors listed below.
Physical
circulation model
Multiple nested ROMS, ca. ~1km resolution in GOM
Tides (M2, S2, N2,
6-hourly wind and heat fluxes from NOAA/NCEP NOMADS (35-km resolution)
River runoff data from USGS
Sea surface temperature from satellites
Initial conditions and open boundary conditions from large-scale parent model (HYCOM)
Alexandrium
fundyense model
Population dynamics
from Stock et
al. (2005); McGillicuddy et al. (2005), He et al., (2008) and Li et
al.(2009)
Cyst maps from Fall
2013 Survey in comparison with earlier years, extrapolated based on
Solow et al.(2014)
(http://omglnx3.meas.ncsu.edu/yli/cystmap/cystmap_04_13_v3.png)
Solar radiation from NOAA/NCEP
Monthly climatological nutrient fields from University of Maine
The mortality rate
of A.
fundyense
is now parameterized using the temperature dependent Q10
formulation (Durbin and Durbin, 1992)
An animation showing surface wind fields and modeled bloom conditions from February 1, 2014 to August 10, 12:00, 2014
http://omgsrv1.meas.ncsu.edu/GoMaine_Redtide/2014/weekly_nowcast_forecast/dino_14.htm
A 3-D animation showing modeled surface and subsurface cell abundance
from February 1, 2014 to August 10, 12:00, 2014
http://omgsrv1.meas.ncsu.edu/GoMaine_Redtide/2014/weekly_nowcast_forecast/2014forecast_3d/dino_14.htm

Figure 1. Comparison between observed (left) and modeled (right) surface cell concentration (unit: Cell#/L) during May 02-03, 2014 Tioga 747 Survey. The station locations from
south to north are for ESP-Don, ESP-Jake, and ESP-Dennis, respectively.

Figure 2. Comparison between observed (left) and modeled (right) surface cell concentration (unit: Cell#/L) on May 09, 2014. (Thanks to MWRA for providing preliminary observations)

Figure 3. Comparison between observed (left) and modeled (right) surface cell concentration (unit: Cell#/L) on May 20-22, 2014.

Figure 4. Comparison between observed (left) and modeled (right) surface cell concentration (unit: Cell#/L) on June 15, 2014.

Figure 5. Comparison between observed (left) and modeled (right) surface cell concentration (unit: Cell#/L) on June 16, 2014.

Figure 6. Comparison between observed (left) and modeled (right) surface cell concentration (unit: Cell#/L) on June 17, 2014.

Figure 7. Comparison between observed (left) and modeled (right) surface cell concentration (unit: Cell#/L) on June 14, 2014. (Thanks to MWRA for providing preliminary observations)

Figure 8. Comparison between ESP Don, Jake and Dennis observed (dots) and model simulated (dotted line) surface cell concentration (unit: Cells/L) at location [-70.4432oW, 43.1768oN]
, [-69.9768oW, 43.6872oN], and [-69.4575oW, 43.8029oN] (see Figure 1) .
2014 Seasonal forecast for Alexandrium fundyense in the Gulf of Maine
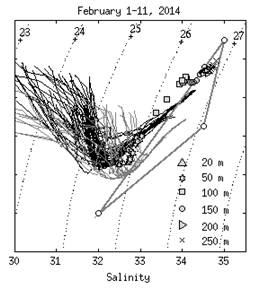
The 2014 seasonal forecast was based on a limited-area cyst survey conducted in fall 2013, extrapolated to a basin-wide cyst distribution (Figure 1) using the procedure described in Solow et al. (2014). The 10 ensemble members consisted of hydrodynamic hindcasts for the years 2004-2013 (Figure 2). An example snapshot from the ensemble forecast illustrates the variations in abundance and distribution resulting from varying hydrographic conditions (Figure 3). See http://omgsrv1.meas.ncsu.edu/GoMaine_Redtide/2014/seasonal_ensemble/2d/14ensemble_2d.gif for animated version of the model output. Simulated time-mean cell concentrations in the western Gulf of Maine from the ensemble forecast suggest a modest bloom, falling in a range bounded by hindcast simulations for 2004, 2007, and 2012 (Figure 4). However, recent observations from NERACOOS buoy M (Jordan Basin), suggest hydrographic conditions similar to, or perhaps even more extreme, than present in 2010during which a warm, fresh, low-nutrient water mass anomaly suppressed the bloom (Figure 5). If such conditions are present again during the upcoming bloom season in 2014, A. fundyense concentrations maybe even lower than those predicted by the ensemble forecast.
For the most
recent descriptions of
the forecast model see He (2008), Li (2009), McGillicuddy et al. (2011).
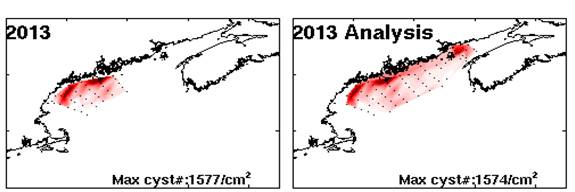
Figure 1. Observed (left) and extrapolated (right) cyst abundance for fall 2013. Extrapolation based on the method of Solow et al. (2014).
Figure
2. Ensemble members for
the 2014 seasonal forecast.
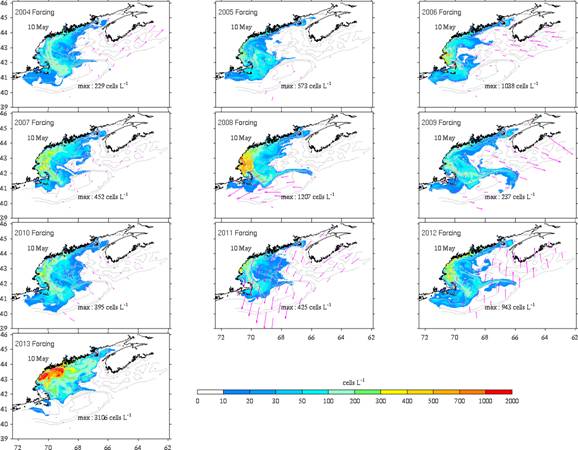
Figure 3. Example snapshot from the 2014 ensemble forecast.
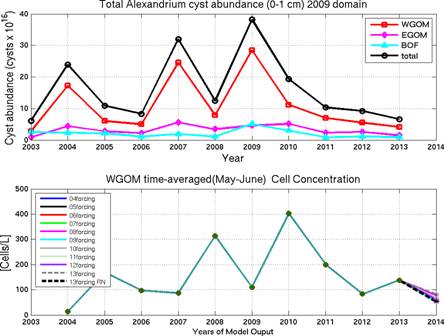
Figure 4. Time-series of observed cyst abundance (top) and time-mean A. fundyense cell concentration (bottom) in the western Gulf of Maine from hindcast simulations (2004-2013) and the ensemble forecast (2014). In the upper panel, cyst abundances reported as 2003 were actually collected in 1997 (Gulf of Maine) and 1980-1982 (Bay of Fundy). The 2004 hindcast was computed as if cyst abundance did not change between the times of those measurements and the 2004 bloom season.
Figure
5. Temperaturesalinity
diagrams from NERACOOS mooring M in Jordan Basin. Dotted lines are
contours of sigma-T density anomaly. Vertices of the mixing triangle
consist of the canonical water-mass characteristics for Warm Slope
Water (WSW), Labrador Slope Water (LSW), and Scotian Shelf Water (SSW)
described in Smith et al. (2001). Gray lines are CTD casts from
2008 (a “normal” year), and black lines from 2010 when the A. fundyense
bloom was suppressed (McGillicuddy et al. 2011).
He, R., D. J. McGillicuddy, B. A. Keafer, and D. M. Anderson. 2008. Historic 2005 toxic bloom of Alexandrium fundyense in the western Gulf of Maine: 2. Coupled Biophysical Numerical Modeling. Journal of Geophysical Research-Oceans 113: C07040, doi:07010.01029/02008JC004840.
Li, Y., R. He, D. J. McGillicuddy, D. M. Anderson, and B. A. Keafer. 2009. Investigation of the 2006 Alexandrium fundyense Bloom in the Gulf of Maine: In situ Observations and Numerical Modeling. Continental Shelf Research 29: 2069-2082.
McGillicuddy, D. J., D. W. Townsend, R. He, B. A. Keafer, J. L. Kleindinst, Y. Li, J. P. Manning, D. G. Mountain, M. A. Thomas, and D. M. Anderson. 2011. Suppression of the 2010 Alexandrium fundyense bloom by changes in physical, biological, and chemical properties of the Gulf of Maine. Limnology and Oceanography 56: 24112426.
Smith, P. C., R. W. Houghton, R. G. Fairbanks, and D. G. Mountain. 2001. Interannual variability of boundary fluxes and water mass properties in the Gulf of Maine and Georges Bank. Deep-Sea Research II 48: 37-70.
Solow, A. R., A. R. Beet, B. A. Keafer, and D. M. Anderson. 2014. Testing for simple structure in a spatial time series with an application to the distribution of Alexandrium resting cysts in the Gulf of Maine. Marine Ecological Progress Series: in press.
Last update: August 8, 2014