Gulf of
Ruoying He, Dennis McGillicuddy, Don Anderson, Bruce Keafer
Woods Hole Oceanographic Institution
Disclaimer: these simulations are for experimental purposes only.
Results here represent model solutions initiated from a cyst abundance map from late 2005, with germination, growth, and transport of Alexandrium fundyense cells driven by the factors listed below. Note that as the time progresses, there is insufficient cell abundance data over a large area to be assimilated into this model to update it and improve its accuracy. In the future, we hope to obtain such cell abundance information from the integrated ocean observing system, but that capability is a decade away.
Physical circulation model
Multiple nested ROMS, ca. ~1km resolution in GOM
Tides (M2, S2, N2,
6-hourly wind and heat fluxes from NOAA/NCEP EDAS (40-km resolution)
River runoff data from USGS
Sea surface temperature from satellites
Initial conditions and open boundary conditions from large-scale parent model (HYCOM)
Alexandrium fundyense model
Population dynamics from Stock et al. 2005; McGillicuddy et al. 2005
Cyst map from NOAA/EPA Fall 2005 Surveys (http://www.whoi.edu/mr/pr.do?id=11987)
Solar radiation from NOAA/NCEP EDAS
Climatological nutrient fields from BIO (Petrie et al., 2000)
New
Improvement- The mortality rate of A. fundyense is now
parameterized using the temperature dependent Q10 formulation (Durbin
and Durbin, 1992)
Observations
R/V Tioga Surveys
http://science.whoi.edu/users/olga/alex_surveys_2006/WHOI_Alexandrium_Surveys_2006.html
Modeled A. fundyense
bloom
An animation showing
surface wind fields and modeled bloom conditions from
http://science.whoi.edu/users/ruoying/Redtide_06/movie.html
Model-data comparison
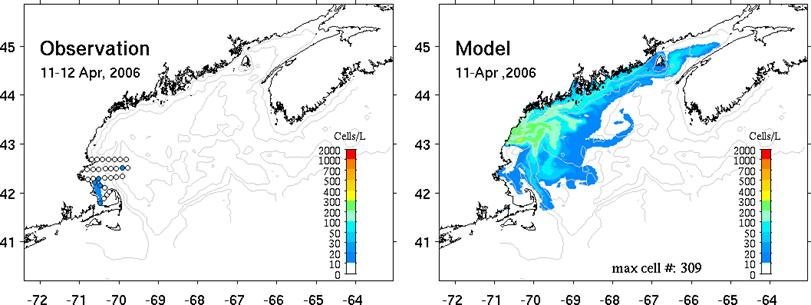
11-12 April: Simulation indicates a swath of low
concentration Alexandrium fundyense cells extending from the Bay of
Fundy to mid-coast Maine; a broader area of cells is located offshore of Casco
Bay, slightly downstream of the WGOM cyst bed. The simulated bloom has
not yet penetrated into Mass/Cape Cod Bays. The distribution has broadened
in the offshore direction, as might occur after upwelling-favorable conditions.
Observations from R/V Tioga cruise 171 confirm low cell concentrations in that
same area. Note: In this simulation, the highest cell concentrations are in the
few hundreds of cells per liter range. This is at or below levels that
would be expected to cause toxicity in shellfish. The model results are
thus generally consistent with shellfish toxicity data from the region – i.e.,
no toxicity yet in
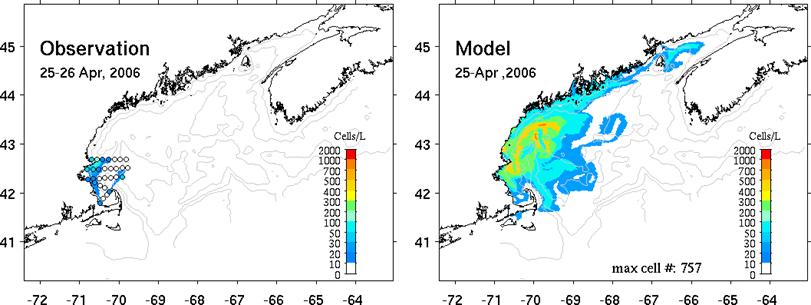
25-26 April: Simulated bloom shows widespread by low cell
abundance (maximum concentrations of 100-200 cells/L) populations along the
coast of western
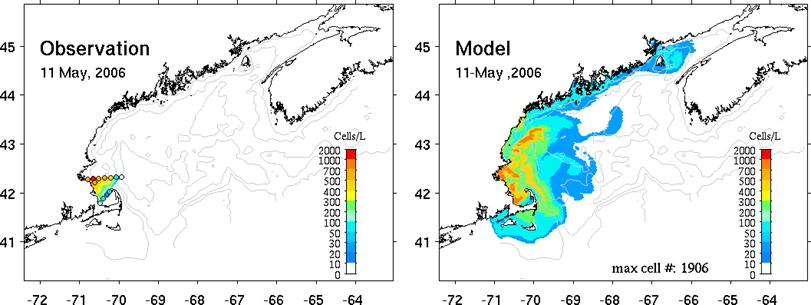
11 May: Simulated bloom shows cells have entered
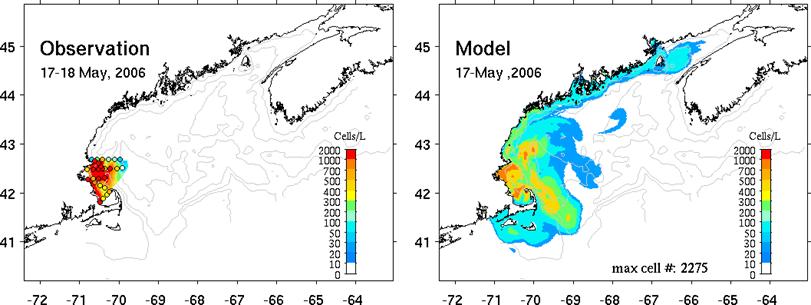
17 May: Simulated bloom shows cells in
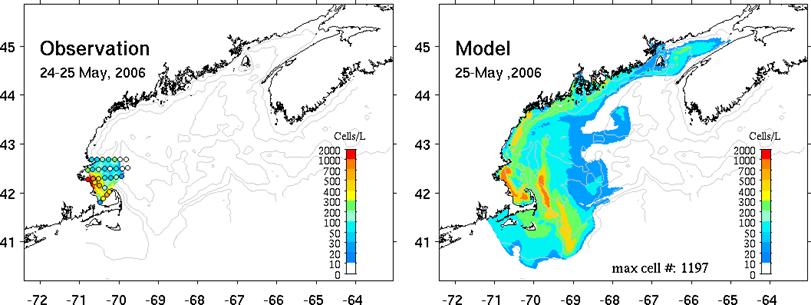
25 May: Observations from R/V Tioga cruise indicate that the Alexandrium abundance has reduced
relative to last week. The observed highest concentrations of Alexandrium
are now primarily located in a patch just off
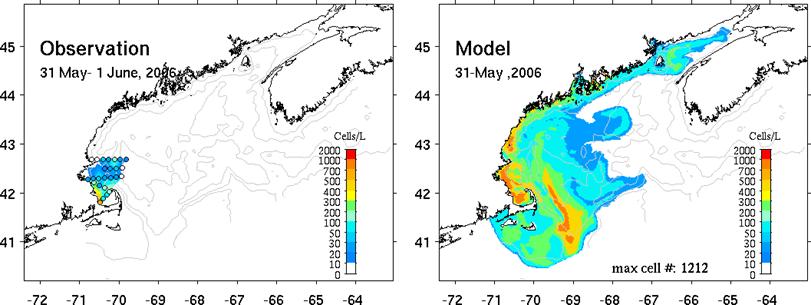
1 June: Observations from R/V Tioga cruise indicate
that the Alexandrium abundance continues to decline compared to last
week. The observed highest concentrations of Alexandrium are now located
in the east entrance of the
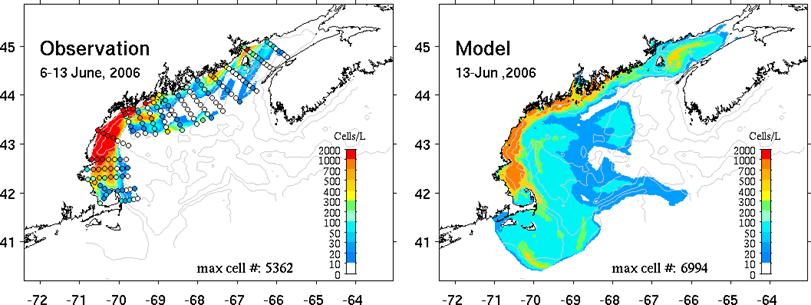
13 June: Observations from R/V Oceanus cruise reveal
the gulf-wide distribution of Alexandrium fundyense. The observed highest concentrations of Alexandrium
are now located between
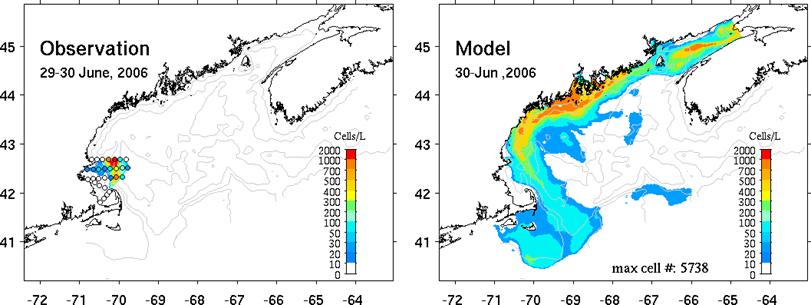
30 June: Observations from R/V Tioga cruise show that areas near the coast within southern
Questions/Comments? Please send an e-mail
Last update: